Rent Growth

U.S. Apartment Market Sustains Solid Pricing Power in January

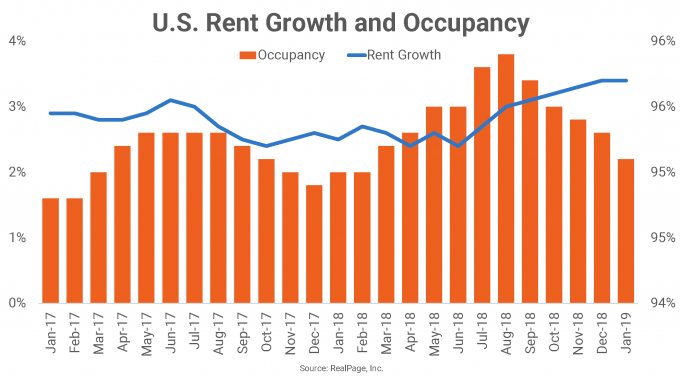
January fundamentals for the nation’s multifamily market continue to look favorable for owners and operators. Rent growth continues to strengthen as occupancy in the market remains very tight.

Average effective rent growth is up 90 basis points (bps) year-over-year to stand at 3.4% nationwide in January. The nationwide rent growth rate hasn’t been this high since August 2016. After hovering below the 3% threshold between mid-2017 and mid-2018, rent growth hit 3% in August 2018 and has been steadily climbing every month since.

Occupancy nationwide has been softening since August but is still up 20 bps year-over-year to stand at 95.1% in January. Occupancy tends to be lower in the colder months, so it’s not surprising that January’s rate has eased from the summer months. January 2019’s occupancy of 95.1% is the highest January rate the U.S. has seen during this economic cycle.


The ranking of top rent growth performers for year-ending January 2019 has many familiar names that have remained high on this list for several months – such as Phoenix, Las Vegas and Atlanta – as well as some newcomers, such as Sacramento. Austin’s 530 bps growth represents the largest year-over-year momentum shift among major markets in the nation.

 
January-Rent-Growth-table-e1550684086448.png
 

None of the nation’s largest 50 markets saw negative rent change in year-ending January. The slowest-growing market, Houston, is seeing rents climb a mere 0.2% annually, but slowing growth has been the case in that market for the last four months or so.

Other laggards include Cleveland with 1.3% rent growth and Kansas City, Anaheim and New York, each with 1.8% rent growth.

Across the nation, about 390,000 apartment units are under construction with about 328,000 projected to complete in the next 12 months. That number is elevated from the previous 12 months when about 267,000 units were completed. In the last year, demand has well outpaced supply, as about 283,000 units were absorbed nationwide.

Dallas, Los Angeles and Washington, DC take the top three spots for the number of units set to complete in the next year. About 23,000 units are scheduled for delivery in Dallas, while 17,500 units and 15,400 units are scheduled for LA and DC, respectively.

However, when looking at scheduled new inventory as a percent of existing stock, Charlotte, Seattle and Dallas take the top spots with 4.1%, 3.9% and 3.8% growth, respectively.

Atlanta Lands Among National Rent Growth Leaders

apartment-market-data-research-reports-multifamily-mpf-research-construction-atlanta-e1549561795623.jpg

Historically a rent growth underperformer, Atlanta’s apartment market has seen considerable price increases during the current economic cycle, and now performs well ahead of the national norm.

Atlanta ranked among the country’s rent growth leaders in 2018, with a price increase of 4.8%. Among the nation’s largest 50 apartment markets, only three bested this performance: Las Vegas, Phoenix and Orlando.

It’s historically been uncommon for Atlanta to raise rents ahead of overall U.S. averages, partially because supply volumes tend to run high in this market. This gave Atlanta an advantage when the national building spree started during the current cycle, and, with the help of a strong local economy, the market absorbed its share of heightened completions relatively well. With occupancy strengthening in the past few years, Atlanta operators were comfortable pushing rents to new heights.

Looking back, rent growth in the Atlanta apartment market hung behind much of the nation for the better part of the past 20 years. But in mid-2013, Atlanta rent growth pulled ahead of the U.S. norm and continued to gain momentum until topping out at 7.4% in early 2015. While that performance has since moderated a bit, today’s growth pace remains strong, a few ticks ahead of the market’s cycle average of 4.1% and well beyond the national standard of 3.3%.

Primarily responsible for Atlanta’s move into the rent growth spotlight has been the performance in the Class C stock, according to the latest RealPage Asset Optimization webcast. As the Great Recession ended in 2009, price positioning bottomed out.…

Primarily responsible for Atlanta’s move into the rent growth spotlight has been the performance in the Class C stock, according to the latest RealPage Asset Optimization webcast. As the Great Recession ended in 2009, price positioning bottomed out. At that time, Atlanta’s more affordable Class C units were suffering annual rent cuts of more than 12%. While the other two product lines were also logging price declines, the damage was less severe, with cuts of roughly 6% to 7%.

Throughout the course of the current economic cycle, the more affordable units have logged the most rent growth progress. For the first few years, all product lines saw rent change mostly improve. Class C units gained ground quickly and peaked at 6% in 2015, overtaking growth in the Class A stock. At the end of 2018, rent growth wasn’t far from that peak at 5.6%. This was one of the best performances seen nationwide for Class C units. The affordable stock did better in only two other markets in 2018: Las Vegas (6.3%) and Phoenix (5.8%).

Atlanta’s Class B product logged a stronger peak at 9.3% in 2015, but has since come down notably, landing at 5.7% in 2018. Class A stock peaked earlier, logging 8% rent growth in 2014 before the increases started to fall dramatically. By year-end 2018, annual rent growth in the most expensive product line was moderate at 3.2%.


While Atlanta rent growth surpassed U.S. norms recently, occupancy here still trails national averages, but not by much. At 94.7%, Atlanta’s late 2018 rate is one of the best showings this market has seen in two decades and is less than 100 basis po…

While Atlanta rent growth surpassed U.S. norms recently, occupancy here still trails national averages, but not by much. At 94.7%, Atlanta’s late 2018 rate is one of the best showings this market has seen in two decades and is less than 100 basis points (bps) below the U.S. reading. Occupancy in Atlanta has traditionally run about 300 bps to 400 bps below the national average.