These apartments offer you health care with your lease

[Source Images: Michael Burrell/iStock, Mike_Kiev/iStock]

[Source Images: Michael Burrell/iStock, Mike_Kiev/iStock]

For most Americans, health coverage is tied to their employment. That means millions of people are uninsured or underinsured—especially during a pandemic that has seen 6 million people directly lose their employer-based coverage. What if you could access a healthcare plan through something else, like your housing? For residents who live in a property owned by Comunidad Partners, that’s now an option.

Comunidad Partners is a real estate investment firm that buys apartment communities, renovates them, and manages them. Comunidad is for-profit, but mission-based. It works in tandem with a nonprofit called Veritas Impact Partners, cofounded by Comunidad managing partner Antonio Marquez, to provide services to its tenants. Together, Comunidad and Veritas brought a virtual healthcare program to Comunidad’s residents.

“We’re always focused on health and wellness, but in the wake of COVID-19, the health and wellness that we would do before, which is focused on diabetes testing, we do dental checkups for kids—this is all in-person, human interaction, and we could no longer do that,” says Marquez. “We needed to pivot and find a virtual way to engage with residents to fulfill our mission of health and wellness.”

Comunidad and Veritas partnered with a Fortune 500 healthcare provider—they won’t reveal who, but Marquez says it’s a household name—for a telehealth contract. This company provides virtual health care to employers, and Comunidad asked that they tailor a program for multifamily communities. Those residents can connect with a doctor or nurse practitioner via an app to be diagnosed or prescribed treatment virtually; the care covers both physical and mental health, and is completely free to residents, and will be available indefinitely, not just during the pandemic.

This housing-provided healthcare became available to Comunidad residents in May 2020, and it’s currently implemented across 2,000 households, impacting more than 6,000 people. That’s about half of Comunidad’s portfolio; Marquez hopes to get it to 100% soon, and says the firm is working on outreach to help residents download and register for the corresponding app. Because the initiative was spearheaded through the nonprofit, Veritas can work with other companies that manage affordable housing properties to bring virtual health care to even more renters. Comunidad Partners hopes it can reach 20,000 households and 60,000 residents in three to five years.

Marquez says this is one of the first instances where families can get free telehealth through a real estate owner-operator, meaning people don’t have to rely on a job to have healthcare coverage. He’s not worried that this will mean residents won’t work or be able to pay their rent, though. If a resident does lose their job, they’ll still have healthcare, and Marques says that Comunidad has programs to help them build their résumé, get trained on vocational skills, or even be connected to a job opportunity.

Marquez says the plan isn’t just about generosity, it also makes business sense. “If you have happier residents, they’re going to live in your property a longer time, and if you have resident retention then your occupancies are higher, operating costs are lower, your turnover costs are lower, and your bottom line is just as healthy—if not healthier,” he says. “Even if somebody’s skeptical about social impact, if they’re only profit driven, then look at this as a strategic imperative as well, so you can do right by your residents but there also is some economic incentive around it.”

Since offering telehealth, Marquez says he’s heard that residents are renewing their leases specifically because they have this option to get healthcare through their housing. “Employment is not a prerequisite to health, and it shouldn’t be. Health and wellness should be an inalienable right,” he says. “It’s not a political statement, it’s just a humanity statement. Frankly we think it’s our obligation to do a little bit more.”

Source

Charlotte Reclaims a Spot Among the Top 10 Rent Growth Markets

The nation’s leader for apartment inventory growth in this cycle is now among the nation’s leaders for rent growth over the past year.

Aggressive development in Charlotte over the past nine years has grown the number of apartments there by 35.5%. The sheer volume of new units has limited the amount that operators could raise rents without also risking a rise in the number of vacancies at their properties. However, they have found short periods when completions temporarily dip that they could be aggressive more on pricing.

They’re finding one such period now. Monthly rents in Charlotte climbed 4.1% in the 12 months ending March 2019, with momentum especially strong in the market’s Class A apartments. In turn, Charlotte, which hasn’t been a top-performing market for nearly six years, claimed the #10 spot for rent growth among the nation’s largest 50 markets in March. That’s actually the second consecutive month in the top 10 for Charlotte, which placed #9 with a 4.2% increase in February.

By comparison, the U.S. averaged annual rent growth in 3.2% in both February and March. Phoenix and Las Vegas topped the leaderboard with increases above 8% in both months.

During most of the previous 18 months, Charlotte’s rent growth trailed the national average. In November, that trend reversed as Charlotte began growing rents faster than the U.S. norm. The last time Charlotte broke into the top 10 for rent growth w…

During most of the previous 18 months, Charlotte’s rent growth trailed the national average. In November, that trend reversed as Charlotte began growing rents faster than the U.S. norm. The last time Charlotte broke into the top 10 for rent growth was in April 2013 when prices were growing by 4.4%, compared to the then-national average of 3.1%.

Charlotte’s rent growth progress has happened despite seeing vast amounts of new supply this economic cycle. Over the last nine years, Charlotte has grown its inventory base by 4.5% annually, on average. Annual new supply peaked most recently in 4th quarter 2016 when nearly 9,000 units were delivered, accounting for 5.6% inventory growth. Since then, new completion volumes have come down to hover at or below the 8,000-mark. In the past year, completions totaled 7,100 units, representing 4% of exiting stock and the lowest volume since 2015.

From a demand standpoint, Charlotte has been in equilibrium with supply. In the final two quarters of 2018, supply and demand stood within 100 units of each other. Though absorption has softened slightly in the first months of 2019 – a normal occurr…

From a demand standpoint, Charlotte has been in equilibrium with supply. In the final two quarters of 2018, supply and demand stood within 100 units of each other. Though absorption has softened slightly in the first months of 2019 – a normal occurrence in the seasonally slow winter months – annual demand remains healthy at about 6,600 units.

As absorption has softened slightly, so has occupancy, though at 94.8% in March 2019, occupancy remains strong. Nationwide, occupancy is a shade tighter at 95.3%. Year-over-year, Charlotte’s occupancy showing was down a slight 20 basis points (bps). Recent highs in occupancy came in July and August 2018 as new supply was moderate – for Charlotte, at least – and leasing ramped up, causing occupancy to surge to 95.7%. Charlotte’s occupancy is expected to pick back up again after 1st quarter 2019.

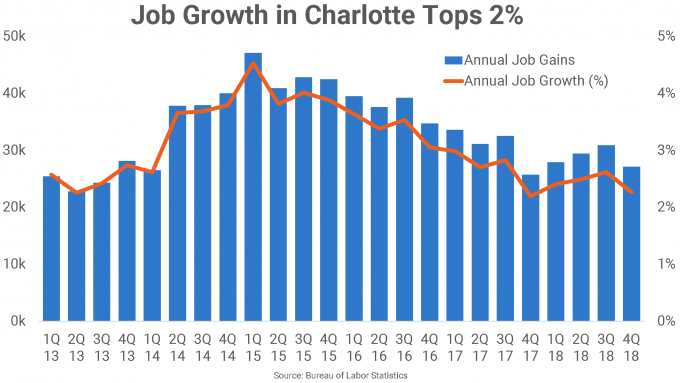
While still strong historically, employment growth in Charlotte has come down from the peak figures this market was seeing just a few years ago in 2015. In the year-ending February 2019, Charlotte added about 24,700 jobs, growing its employment base 2.1%.

Demand drivers remain solid in Charlotte, allowing leasing to keep up with supply. But rent growth has fluctuated with completion volumes, and currently, the market is seeing fewer units come online they in previous months. However, that’s like…

Demand drivers remain solid in Charlotte, allowing leasing to keep up with supply. But rent growth has fluctuated with completion volumes, and currently, the market is seeing fewer units come online they in previous months. However, that’s likely to change in the course of the next year. In the near term, Charlotte’s rent growth is forecasted to trend closer to the U.S. average as annual delivery volumes inch closer to the 8,000-unit mark.

Credited Sources

Real Page

Project Management Facts

Things to discuss with us: ✔ The start date of the project ✔ What are the project tasks ✔ Who is working on each task ✔ Start and finish a task ✔ Capital Expenditures Budget Preparation ✔ Duration each task will take ✔ The finish date of the project

Things to discuss with us: ✔ The start date of the project ✔ What are the project tasks ✔ Who is working on each task ✔ Start and finish a task ✔ Capital Expenditures Budget Preparation ✔ Duration each task will take ✔ The finish date of the project

Did you know that... Only 2.5% percent of companies successfully complete their projects. Aren’t the numbers staggeringly disappointing? They are, for sure. Managing projects is no less than running a small city. You have to take care of the projects, resources, deadlines, manage the budget, ensure proper communication, foresee potential risks and what not. Taking care of so many things can be nerve-wracking and it’s not surprising if something or the other slip out of your mind. Every day we hear the same stories, common challenges, and issues in project management. Yet we fail to learn our lesson out of these stories. Being a project manager, have you ever wondered why only a handful of companies manages to deliver projects successfully whereas you struggle to even meet the deadlines? It’s because besides having the ability to plan, manage resources, and meet deadlines, one must possess the ability to foresee the challenges that may hamper the progress of the overall project.

CONTACT US!

Wilmington, NC Apartment Rent Growth Spikes After Hurricane

Wilmington-Annual-Rent-Change-chart-e1547845462551-1024x575.png

When Hurricane Florence came ashore near Wilmington, North Carolina in mid-September 2018, the local housing stock suffered significant damage. Those displaced have struggled to find alternate housing, as the area’s apartment stock is limited to just 22,000 apartments – just 1,100 or so of them vacant prior to the hurricane. The occupancy rate has jumped from about 95% to roughly 97% in recent months. Even more striking is the acceleration of rent growth. After annual rent growth had averaged about 3% during the previous five years, calendar 2018’s pricing upturn came in at 6.9%. Wilmington will be an interesting market to watch in 2019. Texas and Florida metros that experienced hurricane damage in 2017 tended to register tightened apartment markets during early 2018, but then sometimes returned to pre-hurricane performance levels in the final months of the year.

Apartment Construction is Remarkably Spread Out in Austin

Austin has seen one of the nation’s most aggressive inventory growth rates during the current cycle, and 2019 is set to deliver more of the same. But unlike in most other market leaders for inventory growth, developers in Austin haven’t focused their efforts on any certain area. Instead, construction has been remarkably spread out across the Austin market.

In total, apartment developers have completed more than 60,000 new units in Austin during the current economic cycle, which began in early 2010. This new stock grew the existing inventory base by a stunning 30.8%. This was the second-largest increase among the nation’s 50 largest apartment markets.

Inventory-Growth-Leaders-table-e1551375855812.png

Also growing their apartment stocks by about a third in the cycle were Charlotte, where almost 47,000 units were delivered, and Nashville, which saw the completion of nearly 36,000 units. In both of those Southeast markets, a handful of submarkets accounted for the bulk of new units in the cycle. Charlotte’s Uptown/South End received nearly a quarter of the market’s total new apartments. In Nashville, a third of deliveries went to the downtown Central Nashville area.

Out of Austin’s 16 submarkets, 11 have recorded delivery of 3,500 units or more during the current cycle, with only two receiving supply of more than 5,000 units. Not one submarket accounted for even a 10% share of the deliveries seen during the current cycle. By spreading these completions out across the market, individual submarkets have mostly avoided periods of oversaturation.

Southwest Austin and Cedar Park received the biggest completion volumes, with about 5,600 units delivering in Southwest Austin and nearly 5,500 units coming online in the northwestern Cedar Park area. Even these supply leaders each accounted for only about 9% of the market’s total new supply tally from the past eight years. New product in both locales was absorbed fairly quickly. While completions in Cedar Park increased the existing inventory base by more than 70%, this was an area that had seen very little new product before the cycle began.

By-Submarket-chart-e1551375971755.png

Accounting for about 8% of Austin’s cycle delivery volumes were the northern submarkets of Pflugerville/Wells Branch, Round Rock/Georgetown and North Central Austin as well as the southern university community of San Marcos. These are the four least expensive submarkets in Austin.

Even Austin’s urban core – the expensive Downtown/University area – only received about a 7% share of new supply in the current cycle. The Arboretum accounted for Austin’s smallest slice of the completion pie, with 0.5% of the total.

As a result of new product additions being geographically dispersed, occupancy in Austin has closely mimicked the U.S. norm. That’s significant given the sheer volume of new units delivered to Austin over the course of this cycle, and a rare feat for such a high-development market. Rent growth, however, has been more prone to swings.

In the year ahead, overall delivery volumes in Austin are expected to remain elevated, as 2019 is on tap to be the sixth consecutive year in which completions reach 8,500 or more units. Some performance slowdown is expected, given the length of this…

In the year ahead, overall delivery volumes in Austin are expected to remain elevated, as 2019 is on tap to be the sixth consecutive year in which completions reach 8,500 or more units. Some performance slowdown is expected, given the length of this cycle’s supply wave and the mounting completions.

For more on performance expectations for Austin’s apartment market, see 2019 U.S. Apartment Market Outlook.


Miami Apartment Construction Climbs

Miami-Insights-Charts-.png

During the past five years, apartment deliveries in South Florida – the combination of the Miami, Fort Lauderdale and West Palm Beach markets – have averaged 9,900 units. Miami normally accounts for the biggest portion of those completions, around 46% of the total. Regional scheduled completions in 2019 jump meaningfully to 11,900 units. That increase is due to the escalation of activity in Miami. The 7,700 apartments targeted to finish there in 2019 account for an unusually big 65% of the regional total. Miami’s apartment construction is concentrated in three key neighborhoods – Downtown/South Beach, Coral Gables/South Miami and West Miami/Doral. In those locations, then, it may be tough to push rents in the luxury product space over the next year or two.

U.S. Apartment Market Sustains Solid Pricing Power in January

January fundamentals for the nation’s multifamily market continue to look favorable for owners and operators. Rent growth continues to strengthen as occupancy in the market remains very tight.

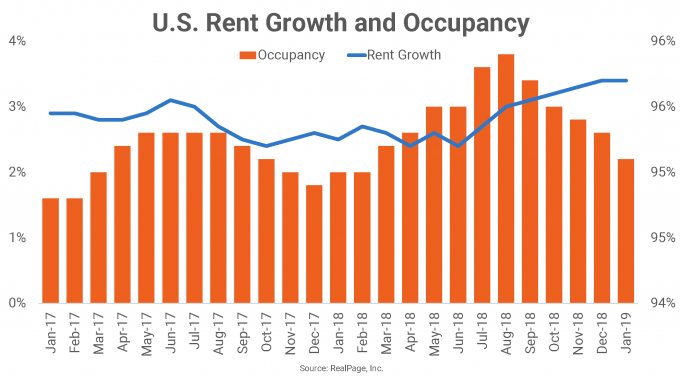
Average effective rent growth is up 90 basis points (bps) year-over-year to stand at 3.4% nationwide in January. The nationwide rent growth rate hasn’t been this high since August 2016. After hovering below the 3% threshold between mid-2017 and mid-2018, rent growth hit 3% in August 2018 and has been steadily climbing every month since.

Occupancy nationwide has been softening since August but is still up 20 bps year-over-year to stand at 95.1% in January. Occupancy tends to be lower in the colder months, so it’s not surprising that January’s rate has eased from the summer months. January 2019’s occupancy of 95.1% is the highest January rate the U.S. has seen during this economic cycle.


The ranking of top rent growth performers for year-ending January 2019 has many familiar names that have remained high on this list for several months – such as Phoenix, Las Vegas and Atlanta – as well as some newcomers, such as Sacramento. Austin’s 530 bps growth represents the largest year-over-year momentum shift among major markets in the nation.

 
January-Rent-Growth-table-e1550684086448.png
 

None of the nation’s largest 50 markets saw negative rent change in year-ending January. The slowest-growing market, Houston, is seeing rents climb a mere 0.2% annually, but slowing growth has been the case in that market for the last four months or so.

Other laggards include Cleveland with 1.3% rent growth and Kansas City, Anaheim and New York, each with 1.8% rent growth.

Across the nation, about 390,000 apartment units are under construction with about 328,000 projected to complete in the next 12 months. That number is elevated from the previous 12 months when about 267,000 units were completed. In the last year, demand has well outpaced supply, as about 283,000 units were absorbed nationwide.

Dallas, Los Angeles and Washington, DC take the top three spots for the number of units set to complete in the next year. About 23,000 units are scheduled for delivery in Dallas, while 17,500 units and 15,400 units are scheduled for LA and DC, respectively.

However, when looking at scheduled new inventory as a percent of existing stock, Charlotte, Seattle and Dallas take the top spots with 4.1%, 3.9% and 3.8% growth, respectively.

Atlanta Lands Among National Rent Growth Leaders

apartment-market-data-research-reports-multifamily-mpf-research-construction-atlanta-e1549561795623.jpg

Historically a rent growth underperformer, Atlanta’s apartment market has seen considerable price increases during the current economic cycle, and now performs well ahead of the national norm.

Atlanta ranked among the country’s rent growth leaders in 2018, with a price increase of 4.8%. Among the nation’s largest 50 apartment markets, only three bested this performance: Las Vegas, Phoenix and Orlando.

It’s historically been uncommon for Atlanta to raise rents ahead of overall U.S. averages, partially because supply volumes tend to run high in this market. This gave Atlanta an advantage when the national building spree started during the current cycle, and, with the help of a strong local economy, the market absorbed its share of heightened completions relatively well. With occupancy strengthening in the past few years, Atlanta operators were comfortable pushing rents to new heights.

Looking back, rent growth in the Atlanta apartment market hung behind much of the nation for the better part of the past 20 years. But in mid-2013, Atlanta rent growth pulled ahead of the U.S. norm and continued to gain momentum until topping out at 7.4% in early 2015. While that performance has since moderated a bit, today’s growth pace remains strong, a few ticks ahead of the market’s cycle average of 4.1% and well beyond the national standard of 3.3%.

Primarily responsible for Atlanta’s move into the rent growth spotlight has been the performance in the Class C stock, according to the latest RealPage Asset Optimization webcast. As the Great Recession ended in 2009, price positioning bottomed out.…

Primarily responsible for Atlanta’s move into the rent growth spotlight has been the performance in the Class C stock, according to the latest RealPage Asset Optimization webcast. As the Great Recession ended in 2009, price positioning bottomed out. At that time, Atlanta’s more affordable Class C units were suffering annual rent cuts of more than 12%. While the other two product lines were also logging price declines, the damage was less severe, with cuts of roughly 6% to 7%.

Throughout the course of the current economic cycle, the more affordable units have logged the most rent growth progress. For the first few years, all product lines saw rent change mostly improve. Class C units gained ground quickly and peaked at 6% in 2015, overtaking growth in the Class A stock. At the end of 2018, rent growth wasn’t far from that peak at 5.6%. This was one of the best performances seen nationwide for Class C units. The affordable stock did better in only two other markets in 2018: Las Vegas (6.3%) and Phoenix (5.8%).

Atlanta’s Class B product logged a stronger peak at 9.3% in 2015, but has since come down notably, landing at 5.7% in 2018. Class A stock peaked earlier, logging 8% rent growth in 2014 before the increases started to fall dramatically. By year-end 2018, annual rent growth in the most expensive product line was moderate at 3.2%.


While Atlanta rent growth surpassed U.S. norms recently, occupancy here still trails national averages, but not by much. At 94.7%, Atlanta’s late 2018 rate is one of the best showings this market has seen in two decades and is less than 100 basis po…

While Atlanta rent growth surpassed U.S. norms recently, occupancy here still trails national averages, but not by much. At 94.7%, Atlanta’s late 2018 rate is one of the best showings this market has seen in two decades and is less than 100 basis points (bps) below the U.S. reading. Occupancy in Atlanta has traditionally run about 300 bps to 400 bps below the national average.